
Article: Our Next Blog Series! Data Collection Pt 1
Tags
- All
- Training (4)
- Account Management and Security (9)
- Features of Dedoose (9)
- Dedoose Desktop App (1)
- Dedoose Upgrades and Updates (5)
- Dedoose News (6)
- Qualitative Methods and Data (11)
- Other (5)
- Media (5)
- Filtering (5)
- Descriptors (10)
- Analysis (22)
- Data Preparation and Management (20)
- Quantitative Methods and Data (5)
- Mixed Methods (20)
- Inter Rater Reliability (3)
- Codes (26)
Data analysis software can be an invaluable tool in uncovering the mysteries hiding in your data. As we all know too well however, data analysis cannot be done without the data! In this new blog series, we will be going over the process we followed to set up and analyze a project. First things first, let’s go over our starting conditions.
- We will make the focus of our study public statements from the EU and US
- All data needs to be publicly accessible
- We should have close ended/categorical data to be able to group our data
These starting conditions ensured that our project and results could be shared publicly and allow us to define well within the Dedoose system.
Now, let’s get started!
We knew the focus of our study would be statements from the EU and US State Department and as such we looked to cast as wide a net as possible to get started. We went to the modern person’s best friend, Google.com and googled transcripts for press releases from the EU.
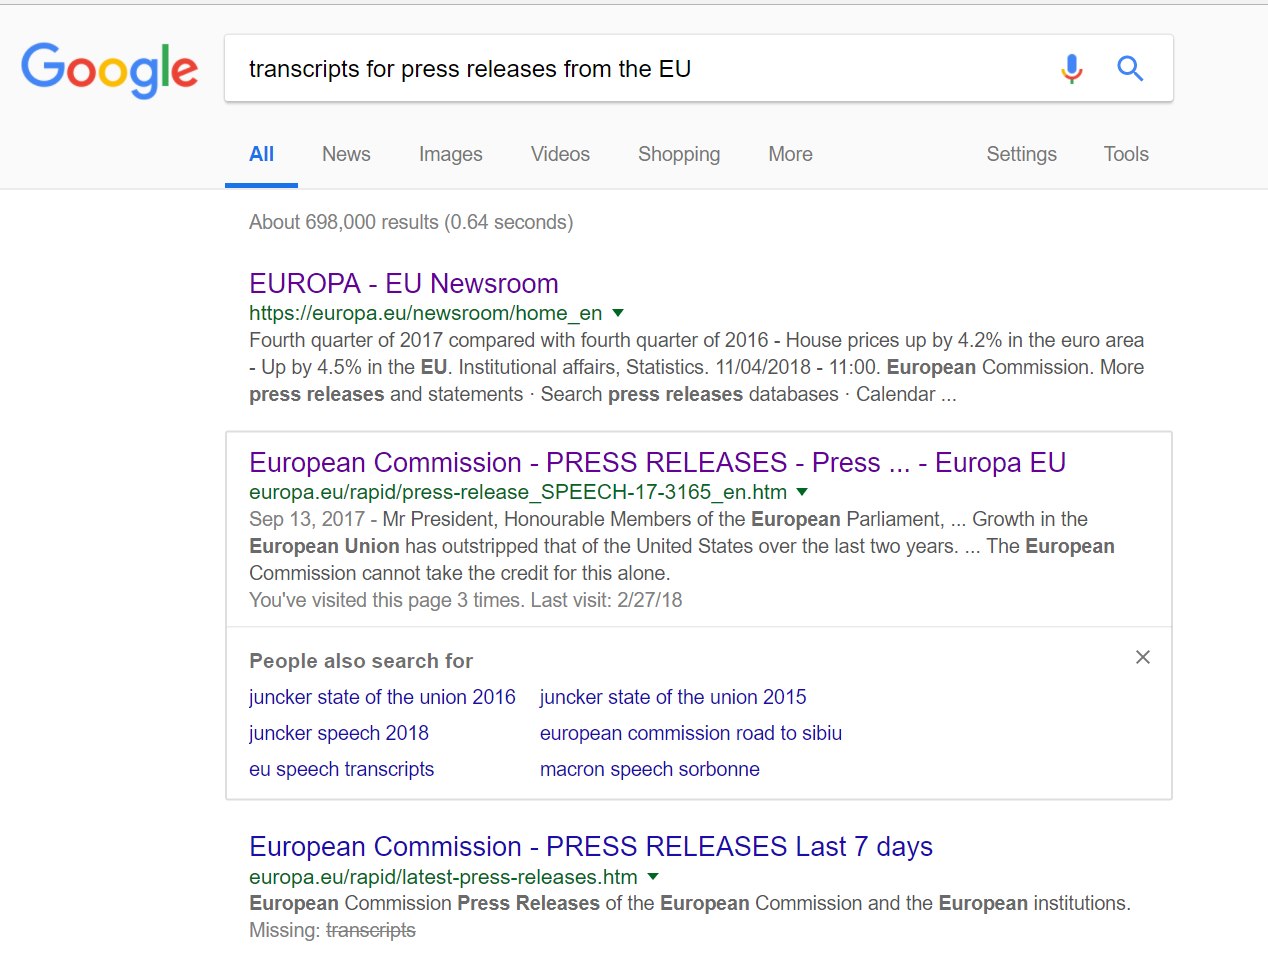
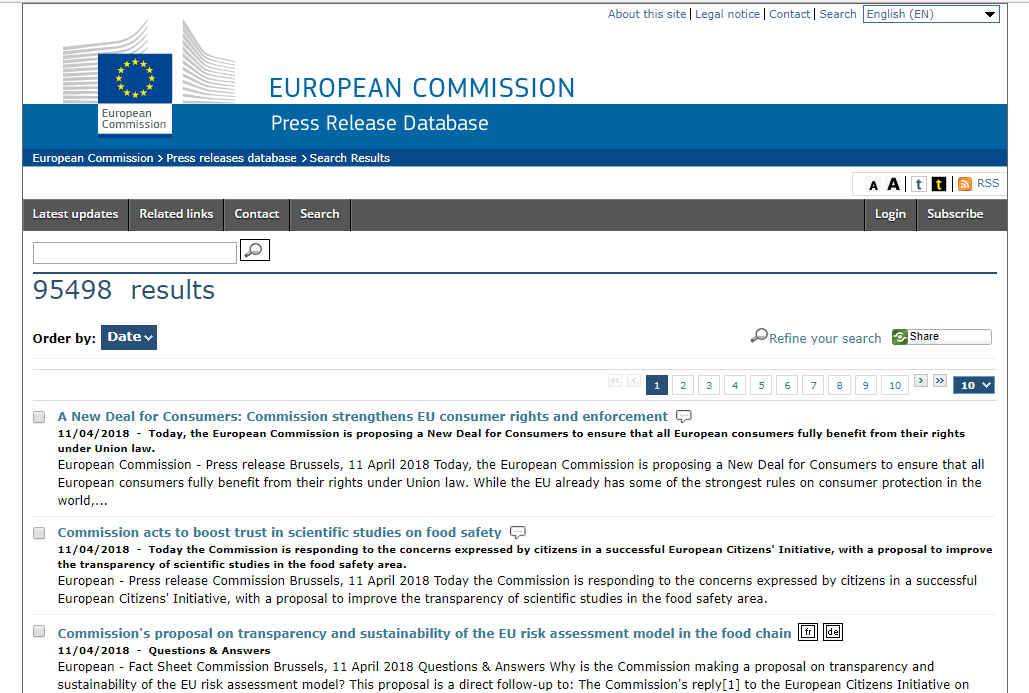
Luckily for us, the EU has an awesome repository of transcripts and while we did need to filter out transcripts due to the sheer number (and some only being available in non-English languages) we fully recognize that we lucked out here:
Transcripts from the USA proved harder to make progress on. Initially we searched for transcripts of any kind, however found it difficult to find a consolidated source. The only data we were able to find transcripts for were individual department press releases and speeches. Upon reflection, since the original premise was transcripts from EU public statements, we deemed the State Department the most appropriate. While this made it easier to locate the files we needed, the sites did not have downloads available. As a result, we had to print each of the pages to PDF separately. (Something we were able to automate)
With that, we were able to gather all of the transcripts we could ever want, but this was not the end of our data gathering stage. We also needed to break up our data into meaningful categories. One thing to note here, is that we were thinking of what groups we could break up our data into at all stages of data gathering. This is not something we saved for the end. The information we chose to break our data into was what we could find in the transcripts themselves:
- Quarter
- Year
- Document Title
- Region
- Source
With this data we can truly begin our work in Dedoose. While we understand that every study is different and this may not be applicable to all of them, we believe this is a good place to start when gathering publicly available data. As this blog series continues we’ll be covering how we completed this project as we move on to the next phase.
Are you interested in a particular data collection method or project set up type? Please let us know, we’d love to make a blog for it! Any other comments, suggestions or concerns are very welcome as well. Our users are our most powerful resource, keep those ideas coming!
Don’t forget to check out our Events! From webinars to conferences, we love to make ourselves available for you, check out the events here: http://www.dedoose.com/about/events