Article: Code Rating/Weighting—what’s that all about?
Tags
- All
- Training (4)
- Account Management and Security (9)
- Features of Dedoose (9)
- Dedoose Desktop App (1)
- Dedoose Upgrades and Updates (5)
- Dedoose News (6)
- Qualitative Methods and Data (11)
- Other (5)
- Media (5)
- Filtering (5)
- Descriptors (10)
- Analysis (22)
- Data Preparation and Management (20)
- Quantitative Methods and Data (5)
- Mixed Methods (20)
- Inter Rater Reliability (3)
- Codes (26)
- Tags:
- Codes
4/22/2014 From our CEO, Eli Lieber - As a follow up to our last post on building solid and useful code systems, we want to help bring everyone up to speed on another dimension you can bring to your qualitative research from a mixed methods perspective—code ratings/weights. I was first introduced to this idea when learning about the Ecocultural Family Interview (EFI) model. The EFI is really more an approach to exploring a research question through studying the activities and routines or your research population. For example, our demo project data come from a study of emergent literacy development in children who attend Head Start programs. Thus, it was important to understanding what was happening in the homes of these families that might support the development of the skills kids need when it comes time to learn to read. Our approach was to interview moms about home activities and routines related to literacy related experiences. One key theme we focused on was reading events—when mom reads to the child, when others read to the child, what those reading episodes look like, and how they vary. Needing to developing codes like ‘Reading by Mother’ and ‘Reading by Others’ was pretty obvious to tag excerpts where moms were talking about these things. But to take things further, and core to the EFI model, is the question of whether we could also classify these excerpts along some dimension.

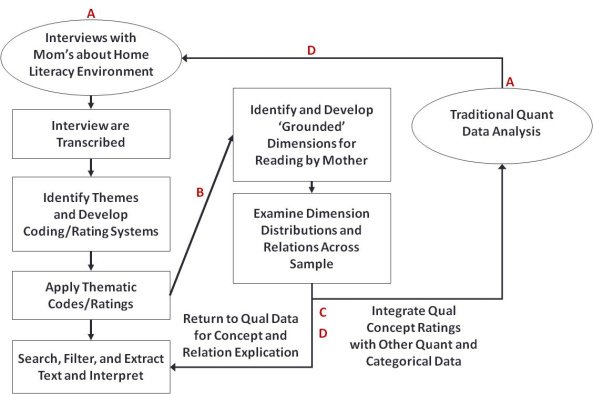
If so, what might this ‘dimension’ look like? First, not all codes will lend themselves to this exercise. But, where you can, building rating/weighting system can bring a wonderful new dimension to your project that allow you to explore the data in a whole new way and opens the door for a variety of new analyses. As a basic example, we sought to index ‘quality of reading’ when looking at excerpts we tagged with ‘Reading by Mother.’ To build this dimension, we grabbed a bunch of ‘Reading by Mother’ excerpts, handed them to different members of our team, and asked that they create piles of high, medium, and low quality reading stories. When you hear things like, ‘my child is too young to read and I don’t read well, so reading at this time isn’t too important, and the school will teach them when it comes time,’ it is easy to classify that as low quality. Compare that to moms who report reading daily to their child and, without fail, at bedtime for at least 30 minutes—easy to call those high quality stories. So, the highs and lows were pretty easy to see, so we called those 1s (low) and 5s (high), and the rest of the excerpts ended up in the messy middle pile. From there, we did it again with the ‘middle’ excerpts. The rules for division in this middle pile were more subtle, but we got it done with, as clearly as possible, and then defined our criteria for assigning 2s, 3s, and 4s. Call it an iterative pile sort exercise. And when you can do it, low and behold!—we’ve got a 5-point rating scale to index quality of reading experience that could be applied alongside tagging with the ‘Reading by Mother’ code. Here’s a model for how this might look in a mixed methods study:

In column and oval ‘A,’ you’ve got your separate qualitative and quantitative data. The qual data you can work with in traditional ways—develop and apply codes, filter, sort, retrieve, and interpret—and the quant data you can also work with in traditional ways—univariate, bi-variate, multi-variate analysis, ANOVA, MANOVA, and so on. But where you’ve got a dimension (arrow ‘B’) that you’ve built off the qualitative excerpting (we call them grounded since they are developed ground-up off the qualitative data), you can incorporate them into more traditional quantitative analysis (arrow ‘C’) AND use them to connect back into the qualitative data as guides for deeper analysis. Thus, the dimensions serve as a mechanism to link the different types of data and allow for the asking of question back and forth across the divide (arrows ‘C’ and ‘D’).
We wrote all about inter-rater reliability for code application in our last blog (here’s a link there, just in case: Coding). Similarly, if we are looking to build a rating system, it too needs to be well articulated and tested for consistency in ratings. Test a system like this using Pearson’s Correlation Coefficient as an index for inter-rater assignment and you can argue the system is well tested and reliably applied.
So what are they good for?
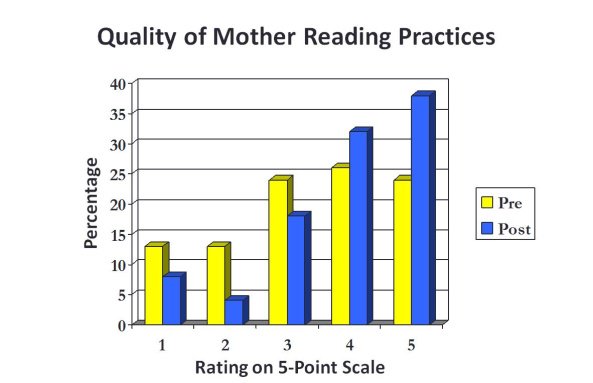
Our emergent literacy study was an experiment, so we had data from before and following an intervention. In this context, we can visualize the results in charts. For example:

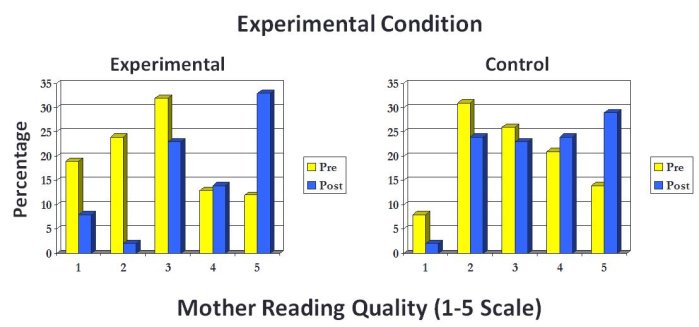
Charts like this are built into Dedoose and, remember, one cool thing about Dedoose is that when you click on a bar in a display like this, you pull up the underlying excerpts so you can quickly ‘feel,’ explore, and understand what is happening across the dimension at the different time points. Here’ another example of what you can offer your research audience:

These visuals help communicate a great deal of information and are a wonderful way of quickly telling the surface story that can be flushed out further via the rich underlying qualitative content.
It is important to keep in mind that these systems can be developed for any concept/theme where a distribution can be represented on a numerical dimension. These distributions can be used to represent relative importance, quality, centrality, ‘sentiment,’ strength, reliability… anything that you can map to a numerical dimension. As another broad example, those in intervention work have indexed dimensions of ‘reliability’ or ‘consistency’ to index what patients might communicate about following a diet or medication regime. That is, many may talk about following a doctor’s instructions, but how closely they follow these directions can vary. When the groups can be divided based on level of ‘reliability’ or ‘consistency,’ we can learn much more about differences in those who have more or less success. From there, we can devise interventions or communication strategies to more closely address the specific challenges and, hopefully, encourage more successful outcomes.

So, go use your imagination, fire up Dedoose, define your tag weighting/rating systems, and see your data come to life in entirely new and ‘AWESOME’ ways!
Cheers for now and Happy Dedoosing!